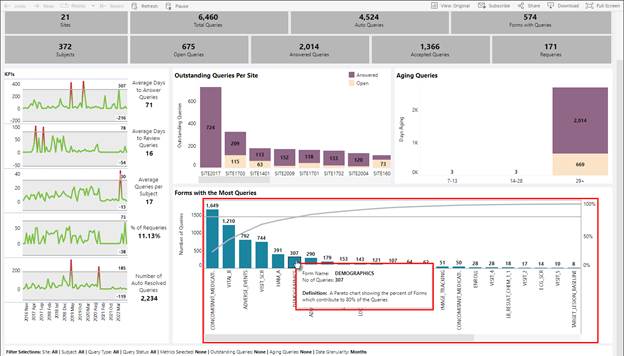
Pareto Chart Displays on the Query Dashboard.
The Forms with the Most Queries (Pareto Chart) in
this system contains both bars and a line graph to represent data for the
category. Individual values display as
bars (form name displays below each bar) in descending order (most to
least). The cumulative total of the
values is represented by the line.
1.
Click on
an element in a Pareto chart (bar, line, identifier).
2.
The system
displays a full screen view of the data.
a. Use the menus, located above the chart, to
select the metrics to display.
b. Refer to Filter via Drop-down Menus for details about using the drop-down
menu options.
3.
Use the
system options to drill through to additional detail for the categories
represented in the chart.
a. Refer to Pareto Chart Filter for details.
b. After making selections from one (1) or more
menus, click the Apply button and the graph updates to display values
for the selected metrics.
Figure 70: Pareto Chart
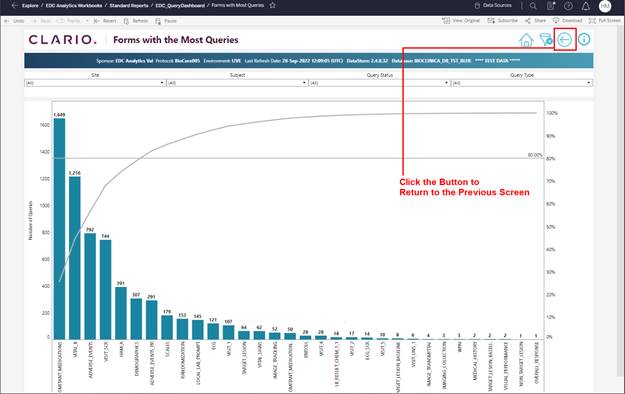
Figure 71: Click on Back Button to Return to Previous View
Related Topics
Common Dashboard Features and Navigation
Pareto Chart Filter