When your permissions allow access to multiple environments, select and navigate between options using the filter menu from a Dashboard screen. Refer to Filter Environment (button) for additional information. You must be logged in to the system to access via this option.
1.
On a
Dashboard screen, click the ![]() (filter)
button.
(filter)
button.
2.
The
Dashboard Filters tile opens.
3.
Open a
drop-down menu and click on an option/check box/check mark to make a
selection. Menu options may vary
based on your permissions and location in this system.
Click in a check box to select an option; click on check mark to deselect
an option.
Examples include (but are not limited to):
a. Protocol - Environment (all screens)
b. Site/Subject/Object/Location
c. Form Entry Status
d. Query Type/Query Status
e. Choose Date Granularity – Use this option to
change Timeframe Category display of KPI data; refer to KPI Data (applicable on dashboard screens that display
KPI data).
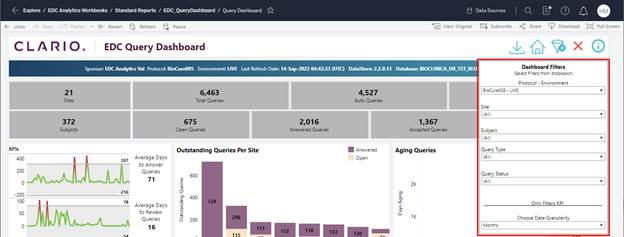
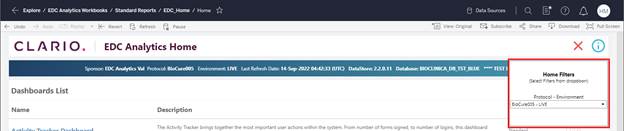
Figure 3: Dashboard Filter Examples
Related Topics