Use the Detail Listings Dashboard Filters to isolate and review specific data. Refer to Filter and Drill Down to Data for details about the filter options in this system.
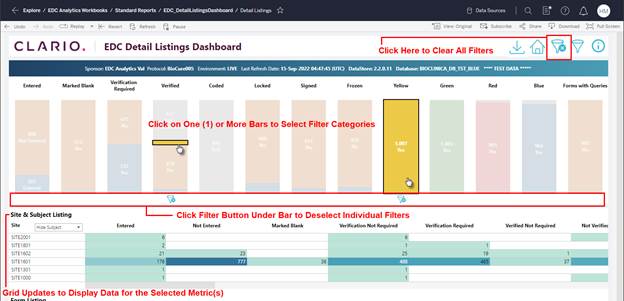
High level detail for Data Listings in the environment displays in a bar graph. Each segment of the graph acts as a Filter. Click on a graph segment and the Site & Subject List grid updates to reflect data for the selection.
·
Click on a
segment in a Bar to filter/limit the onscreen display of results to the
selection(s).
·
Hold the
Ctrl key (keyboard) and continue to click on Bar graph segments and the
onscreen display updates to include all selected metrics.
·
By
default, unselected Bars (filters) display as lowlighted. To return to viewing all bars in
the graph as highlighted (full color) while RETAINING the selected
filters, click on any selected filter.
Refer to Dashboard
Filters – Retain Filters and Remove Lowlight.
·
The Site
& Subject List grid reflects filter selections you make. Refer to Site
& Subject List Grid for
details.
·
Selecting
a Metric in the Site & Subject List grid populates the Form List Grid. Refer to Form
List Grid for
details.
Figure 78: Filter Via Bar Chart
Related Topics