The Detail Listings Dashboard presents permission-based high-level information for your study. For details about features and functions that are available on multiple screens within this system, refer to the Navigation and Features, Common Dashboard Features and Navigation, and Glossary sections plus Table 2. Refer to Select an Environment for details about using the Dashboard Filter option to access or change environment selections.
Multiple options are available that allow you to View, Sort, Filter, and Drill Down to additional details about the metrics that display on this screen. Hover over a tile to display onscreen information. Permissioned users may click a link to navigate to additional detail. Many categories allow you to continue clicking to drill further into information, as needed.
·
Update the
onscreen visualization by clicking on a graph segment or grid element to
display data for that selection only.
Hold Ctrl key (keyboard) to select multiple options. Continue to click on graph segments and grid
records to change the onscreen data.
·
Click on a
selected item to deselect it and reset the other metrics. Hold Ctrl key (keyboard) to deselect options
one at a time while retaining the filter on other selections.
·
Click the ![]() (remove filter) button (below bar in graph) to
the remove filter and update the display of detail in the grid.
(remove filter) button (below bar in graph) to
the remove filter and update the display of detail in the grid.
·
Use the
tabs to navigate to other screens within this category (permission based).
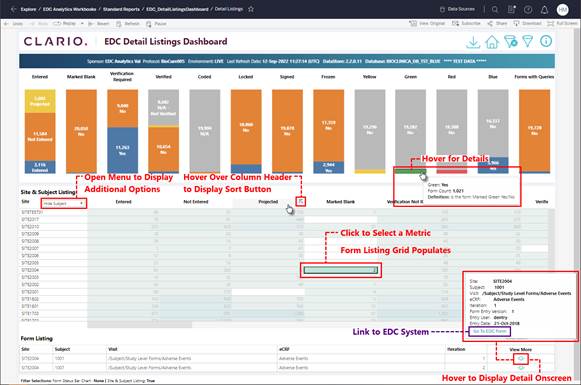
Figure 77: Detail Listings Dashboard
Related Topics
Detail Listings Dashboard Filter
Site & Subject List Grid
Form List Grid